


Darwin’s Game
Based on long term data since 1926 from the Center for Research on Securities Prices, more than half of common stocks have had a negative lifetime return(from IPO through to delisting). The single most frequent outcome for individual stocks over their full lifetime (rounded to the nearest 5%) is a loss of 100%. Despite this, equity markets broadly have outpaced cash by a wide margin over the long term, as indices have been driven by a small number of outlier firms with exceptional returns - history has been written by the winners. And though crypto is still in its infancy by comparison, from the data available there is strong evidence of a similar pattern - the distribution of individual token returns also has significant positive skewness.
Of the top 2000 tokens by market cap (excluding stablecoins and pegged assets), 79% have realized a negative return over the course of their lifetime (as of mid-November 2022). Over two thirds of tokens in this sample have lost more than half their value during their lifetime, with the most common return across the sample (rounded to the nearest whole percent) at -99%. One caveat to note is that whilst a company can dissolve and its stock become delisted permanently, the immutability of blockchains means that the network state of a crypto project could live on in perpetuity, and a token that has declined exponentially may still carry some probability (however small) of recovery, since it is possible for activity to resume again some point in the future. Though for the vast majority of these “dead” tokens, that possibility is purely academic, this may be one constraint in the comparison with individual stock returns since many failed companies stop trading before their price fully reflects the decline.
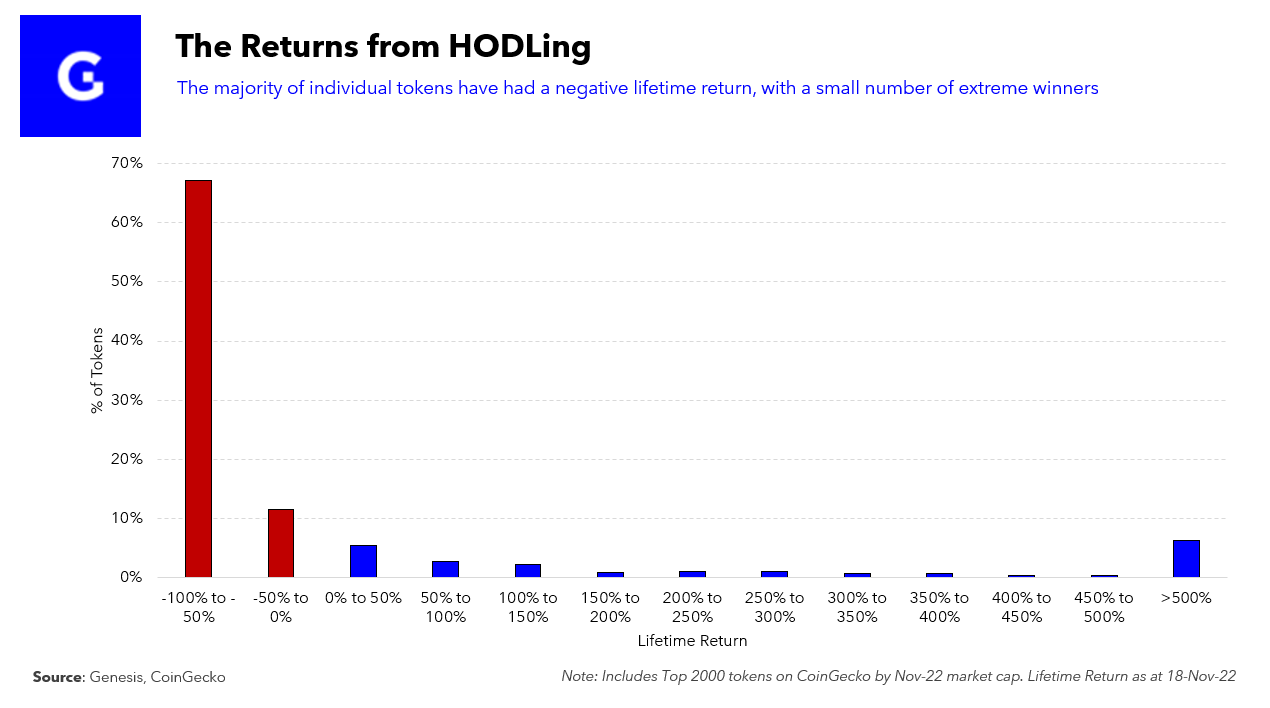
Yet despite this low success rate for individual tokens historically, total crypto market cap has skyrocketed in recent years, from ~$7 billion at the end of 2015 to over $800 billion as of mid November. Whilst the median token lifetime return of this sample has been -81%, the average lifetime return was a staggering +1,211%. Of the minority of tokens that have had positive returns, the largest winners have been so significant that they have driven the performance in this space. 6% of tokens have made over 5x, and the top 1.5% of tokens made over 50x. The degree of positive skewness is more accentuated than in listed equities, which may not be surprising to those who frame crypto as analogous to liquid VC, since it is common for a small number of extreme winners to dominate performance attribution in venture capital.
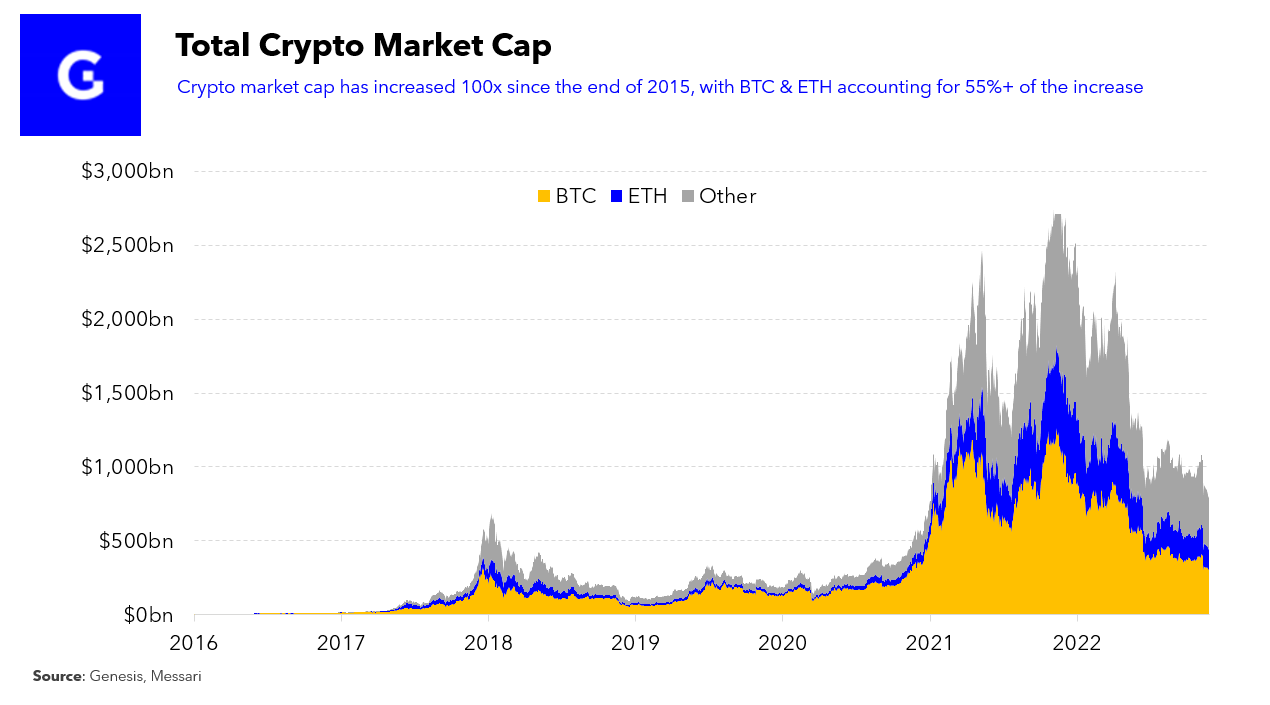
When considering each token’s contribution to the growth of aggregate crypto market value, BTC and ETH tower above the rest. Crypto’s two largest tokens alone account for ~55% of the increase in total crypto market capitalization since 2015. Non-stablecoin derivative activity has also coalesced around BTC and ETH, with a chasm in volumes and open interest between these two and the rest of the token universe. BTC and ETH have also distinctly graduated to be considered pristine collateral within the broader crypto ecosystem.
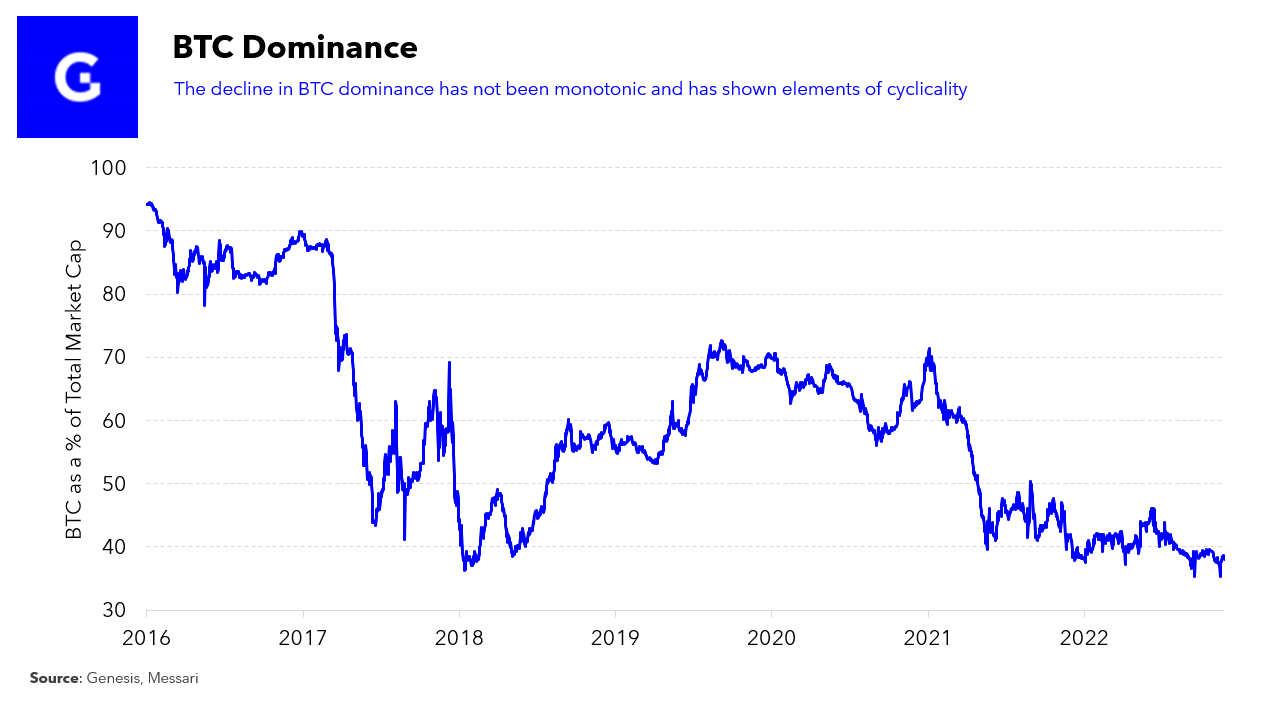
Despite the current pre eminence of BTC and ETH in market cap terms, concentration across the crypto market has declined over time, though the decrease has not been monotonic. The effective number of constituents (ENC) across the top 2000 sat at just under 4 as of mid November, significantly less concentrated than at the end of 2020 when ENC was at 1.8 and bitcoin dominance was over 70%. However, there have also been historical periods in which crypto market cap has been less concentrated than today - in 2017, ENC was at 4.75 whilst BTC dominance went below 40%, as ETH, XRP, and BCH were all a sizable proportion of total market cap.
The Effective Number of Constituents (ENC), calculated as the inverse of the Herfindahl–Hirschman index, is a measure of concentration which indicates the number of constituents in a portfolio whilst taking the distribution of weights into account.
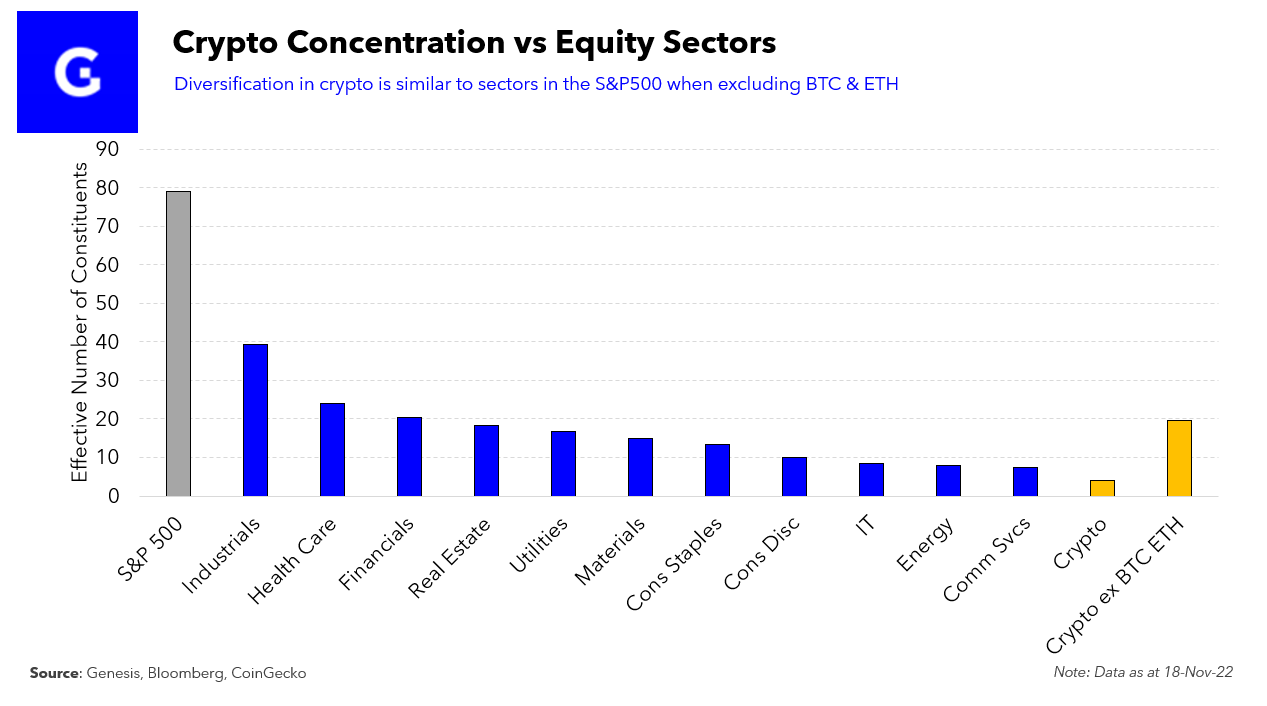
When comparing concentration within crypto to the US equity market, it is no surprise that the S&P 500 is significantly more diversified at present, with an ENC close to 80. Though it is also worth noting that the direction of travel for the equity index has been the opposite to that of crypto, its ENC was over 140 at the beginning of 2016 and it has in fact become more concentrated through time. Whether the token universe will converge over time to the higher level of diversification present in listed equities remains an open question. On the one hand, there are many elements of crypto that tend towards a winner takes all outcome - network effects combined with open source would imply that in equilibrium any inefficiencies are forked out and the optimal outcome for users would be to use the largest protocol (economies of scale). On the other hand, the current concentration may simply be a function of nascency - the token universe has yet to reach a steady state where it is representative of the broader potential applications of the technology (as a pertinent reference for how new the space is, DeFi Summer was only two years ago, even more recent than the advent of COVID-19).
Given the narrower subset of use cases currently represented, a more appropriate comparison could instead be to view crypto as an individual sector. Comparing the top five weights and ENC of crypto to US equity sectors, the difference in concentration is smaller. Crypto is not dramatically out of line from a number of sectors - for instance Communication Services, the youngest sector (introduced in 2018 to reflect the evolution in communications technology) has an ENC of 7.5, with Google and Meta alone making up over 55% of the sector’s market cap in the S&P 500.
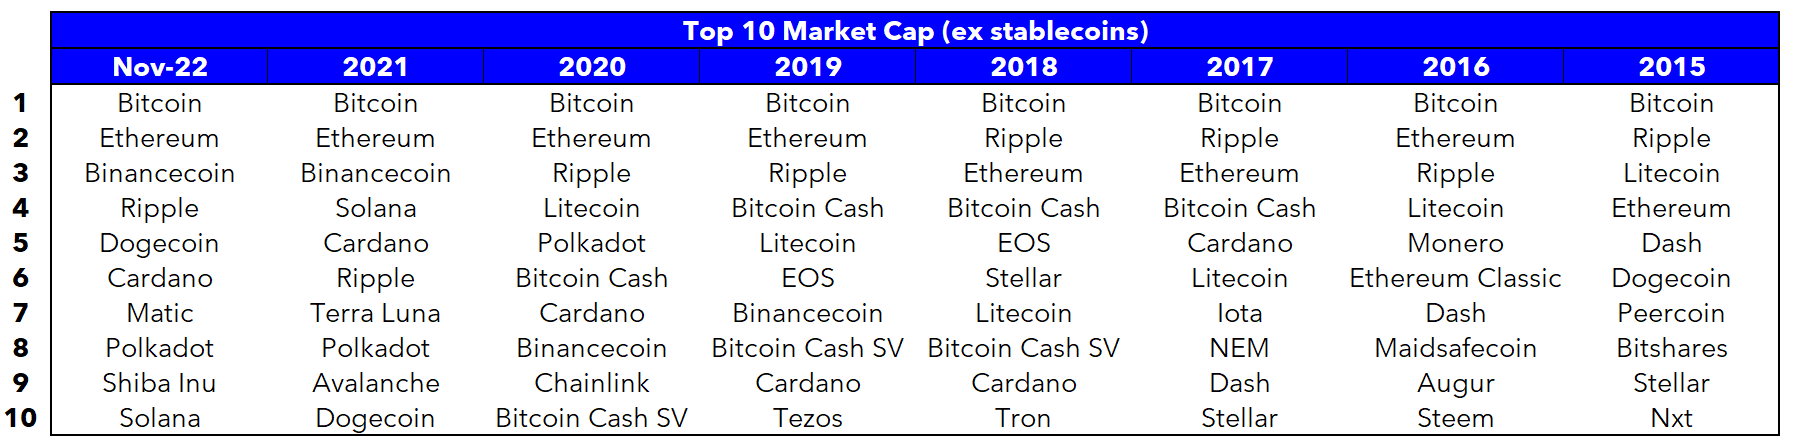
When excluding BTC and ETH, the token universe is more diverse than most US equity sectors. Though lifetime returns have not been directly related to lifespan of the token across the wider sample, Bitcoin and Ethereum have been clear beneficiaries of being early movers, and opinion remains divided on whether this advantage is insurmountable. When considering the historic composition of the largest 10 tokens (ex stablecoins), the turnover in the top 10 names suggests continued competition amongst newer projects - of the top 10 today, two tokens have never previously been in the top 10, and two didn’t exist at the turn of the decade. The mobility up and down the market cap spectrum and diversification beyond BTC and ETH suggests there is no reason concentration should be a destined feature of the token landscape in future as new crypto verticals arise and competition runs its course.
Conclusion
Similar to individual stocks, the distribution of lifetime returns in crypto also displays a positive skewness - the majority of tokens have not had positive returns over their lifetime and a small number of large winners are responsible for the majority of gains. This effect is notably more pronounced in crypto, which may be driven by the early stage nature of projects, the immutability of blockchain state, and the nascency of the space. Whilst market cap is currently concentrated in BTC and ETH, this dominance belies a diverse and dynamic landscape further down the capitalization spectrum on which projects are competing to become the outliers of the future.
About the Author
Authored by Genesis
DISCLAIMER: This commentary is based on public information that we consider reliable, but do not represent as accurate or complete and should not be considered investment advice. Genesis conducts a global prime brokerage service, integrating digital asset lending, trading and custodial services. We and our affiliates, officers, directors and employees could have long or short positions in, act as principal in, and buy or sell the digital assets or derivatives referred to in this research. This research is not an offer to sell or the solicitation of an offer to buy any security in any jurisdiction where such an offer or solicitation would be illegal. The price and value of any assets referred to in this research and the income from them may fluctuate. Past performance is not a guide to future performance, future returns are not guaranteed, and a loss of original capital may occur.


