


Managing Risks: Recognizing, Understanding and Mitigating the Risks Involved in Crossing the (Crypto) Road
Risk management is this year’s dominant theme for the cryptocurrency industry. The failure of several large, opaque crypto firms can be attributed to many things—a lack of transparency, a culture of negligence, a poorly-timed market collapse—but the core feature that these companies had in common is a lack of internal risk controls.
The industry will certainly take time to recover, but today there are several steps businesses can take to avoid common pitfalls. In this report, we will explore how data analytics can help investors quantify risk and present a case study using some common metrics.
Quantifying Risk
In the crypto industry, market activity is spread across hundreds of centralized and
decentralized markets, making it vital to have access to accurate data to understand the unique risk profile of each asset held on a balance sheet. The valuation of a fund’s portfolio is only as strong as its ability to efficiently liquidate their holdings in a black swan scenario, which can only be understood with access to the right data.
Risk metrics such as VaR and expected shortfall, alongside CeFi and DeFi liquidity metrics, are an absolute necessity for any crypto firm in a post-FTX world. While common in traditional financial markets, crypto market participants often lack access to good data, which makes quantifying risk a challenge.
Below, are some examples of essential risk metrics that investors and asset managers can incorporate into their internal risk frameworks:
-
Value at Risk (VaR) and Expected Shortfall (ES): VaR is a risk indicator used to quantify the extent and probability of potential losses in a portfolio, and can essentially assign a cash value to a confidence level. This indicator is used widely throughout the traditional financial world and enables cash reserves management. ES is used in tandem with VaR and answers the question: If VaR is exceeded, how bad will our losses be? Both measures are an integral component of an asset manager’s risk toolkit.
-
Liquidity Metrics - Centralized Markets: Measures such as market depth and price slippage help investors understand the impact of liquidations on the value of their assets. This data is collected across hundreds of individual markets for an asset, and can be aggregated to give a market-wide measure of liquidity. This data can then be compared with an asset’s market capitalization to better understand whether it is over- or under-valued. In a risk framework, it can be used in Mark-to-Market accounting.
-
Liquidity Metrics - Decentralized Markets: Decentralized finance plays a growing role in the crypto-economy and has a unique set of liquidity metrics for determining the ease at which a crypto asset can be exchanged. Measures such as Total Value Locked and slippage can estimate liquidations costs for specific liquidity pools.
There are countless analytics that traditional investors use to quantify risk, and these are just a handful of examples that crypto businesses and investors can begin to incorporate into their Workflows.
Now, let’s explore a case study in how to use this data to understand market volatility.
Case Study: Illiquid Tokens Triggered FTX Collapse
The collapse of the cryptocurrency exchange FTX was triggered by a run on deposits that was exacerbated by extremely poor management of tokens held on the exchange’s balance sheet and the absence of any mitigating risk controls, among more nefarious activities.
More than $14 billion of FTX’s balance sheet was held in a cryptocurrency called FTT, created by the exchange. The problem with FTT was that the token was relatively illiquid, with very little trading activity and buy-side demand.
Just a small trigger caused a wave of selling pressure that the market could not support. Had investors in FTT understood the risks and absence of liquidity beforehand, they could have avoided losses.
Using Kaiko’s cryptocurrency liquidity data, we can see that market depth for FTT was just $8 million dollars before the collapse, a strikingly low number considering the token had a market capitalization of more than $3 billion. As fear gripped the market and sellers rushed to the exit, FTT’s price quickly dropped as bid side liquidity evaporated and market makers removed orders. Today, market depth for FTT is just $50k across all exchanges.
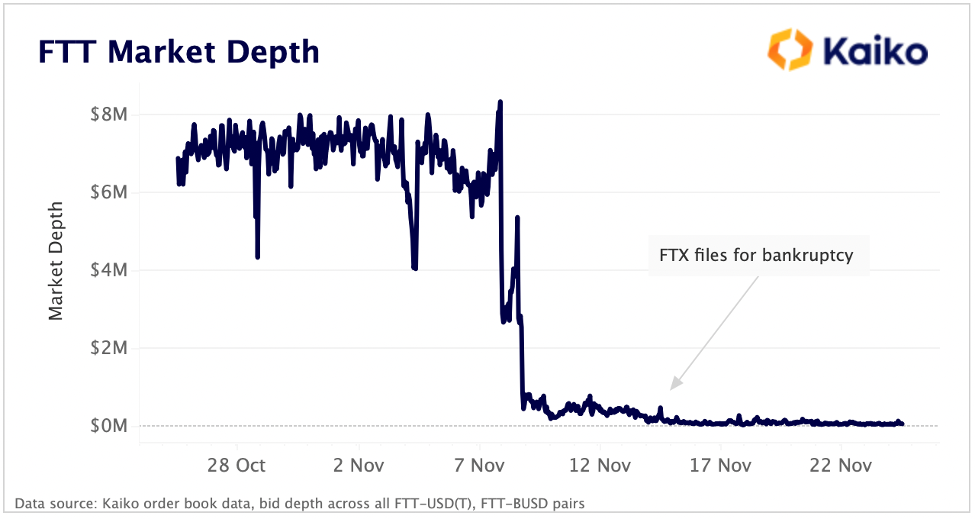
FTT was one of many tokens held on the now defunct exchange’s balance sheet that had virtually no liquidity in centralized markets, but whose market capitalization was valued in the billions of dollars. Had investors and other holders of these tokens paid closer attention to centralized market liquidity using measures such as market depth and price slippage, losses and potential valuation errors could have been avoided.
Conclusion
Data analytics are a vital component in a crypto investor’s toolkit. The valuation of a fund’s balance sheet is only as strong as its ability to efficiently liquidate their holdings. Liquidity metrics, combined with traditional risk metrics such as VaR or Expected Shortfall will enable investors to better survive the next bear market.
About the Author
Authored by Kaiko


